import numpy as np
from qtpy.QtCore import Qt
from qtpy.QtGui import QColor, QPalette, QPen
from qwt import QwtPlot, QwtPlotCurve, QwtPlotMarker, QwtText
from qwt.tests import utils
class VerticalPlot(QwtPlot):
def __init__(self, parent=None):
super(VerticalPlot, self).__init__(parent)
self.setWindowTitle("PythonQwt")
self.enableAxis(self.xTop, True)
self.enableAxis(self.yRight, True)
y = np.linspace(0, 10, 500)
curve1 = QwtPlotCurve.make(np.sin(y), y, title="Test Curve 1")
curve2 = QwtPlotCurve.make(y**3, y, title="Test Curve 2")
curve2.setAxes(self.xTop, self.yRight)
for item, col, xa, ya in (
(curve1, Qt.green, self.xBottom, self.yLeft),
(curve2, Qt.red, self.xTop, self.yRight),
):
item.attach(self)
item.setPen(QPen(col))
for axis_id in xa, ya:
palette = self.axisWidget(axis_id).palette()
palette.setColor(QPalette.WindowText, QColor(col))
palette.setColor(QPalette.Text, QColor(col))
self.axisWidget(axis_id).setPalette(palette)
ticks_font = self.axisFont(axis_id)
self.setAxisFont(axis_id, ticks_font)
self.marker = QwtPlotMarker.make(0, 5, plot=self)
def resizeEvent(self, event):
super(VerticalPlot, self).resizeEvent(event)
self.show_layout_details()
def show_layout_details(self):
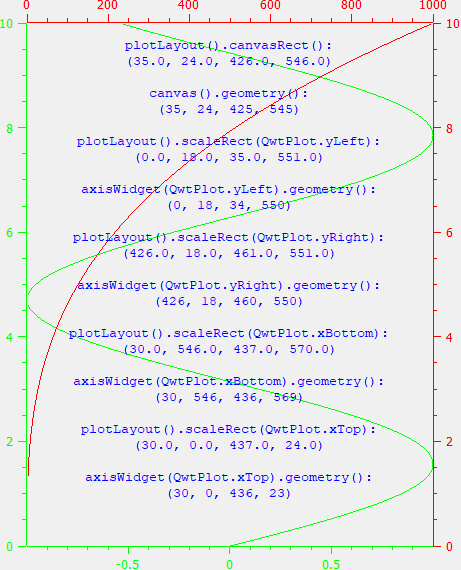
text = (
"plotLayout().canvasRect():\n%r\n\n"
"canvas().geometry():\n%r\n\n"
"plotLayout().scaleRect(QwtPlot.yLeft):\n%r\n\n"
"axisWidget(QwtPlot.yLeft).geometry():\n%r\n\n"
"plotLayout().scaleRect(QwtPlot.yRight):\n%r\n\n"
"axisWidget(QwtPlot.yRight).geometry():\n%r\n\n"
"plotLayout().scaleRect(QwtPlot.xBottom):\n%r\n\n"
"axisWidget(QwtPlot.xBottom).geometry():\n%r\n\n"
"plotLayout().scaleRect(QwtPlot.xTop):\n%r\n\n"
"axisWidget(QwtPlot.xTop).geometry():\n%r\n\n"
% (
self.plotLayout().canvasRect().getCoords(),
self.canvas().geometry().getCoords(),
self.plotLayout().scaleRect(QwtPlot.yLeft).getCoords(),
self.axisWidget(QwtPlot.yLeft).geometry().getCoords(),
self.plotLayout().scaleRect(QwtPlot.yRight).getCoords(),
self.axisWidget(QwtPlot.yRight).geometry().getCoords(),
self.plotLayout().scaleRect(QwtPlot.xBottom).getCoords(),
self.axisWidget(QwtPlot.xBottom).geometry().getCoords(),
self.plotLayout().scaleRect(QwtPlot.xTop).getCoords(),
self.axisWidget(QwtPlot.xTop).geometry().getCoords(),
)
)
self.marker.setLabel(QwtText.make(text, family="Courier New", color=Qt.blue))
def test_vertical():
"""Vertical plot example"""
utils.test_widget(VerticalPlot, size=(300, 650))
if __name__ == "__main__":
test_vertical()