import os
import numpy as np
from qtpy.QtCore import QEvent, QObject, QPoint, QRect, QSize, Qt, Signal
from qtpy.QtGui import QBrush, QColor, QPainter, QPen
from qtpy.QtWidgets import QApplication, QMainWindow, QToolBar, QWhatsThis, QWidget
from qwt import (
QwtPlot,
QwtPlotCanvas,
QwtPlotCurve,
QwtPlotGrid,
QwtScaleDiv,
QwtScaleDraw,
QwtSymbol,
)
from qwt.tests import utils
QT_API = os.environ["QT_API"]
class ColorBar(QWidget):
colorSelected = Signal(QColor)
def __init__(self, orientation, *args):
QWidget.__init__(self, *args)
self.__orientation = orientation
self.__light = QColor(Qt.white)
self.__dark = QColor(Qt.black)
self.setCursor(Qt.PointingHandCursor)
def setOrientation(self, orientation):
self.__orientation = orientation
self.update()
def orientation(self):
return self.__orientation
def setRange(self, light, dark):
self.__light = light
self.__dark = dark
self.update()
def setLight(self, color):
self.__light = color
self.update()
def setDark(self, color):
self.__dark = color
self.update()
def light(self):
return self.__light
def dark(self):
return self.__dark
def mousePressEvent(self, event):
if event.button() == Qt.LeftButton:
pm = self.grab()
color = QColor()
color.setRgb(pm.toImage().pixel(event.x(), event.y()))
self.colorSelected.emit(color)
event.accept()
def paintEvent(self, _):
painter = QPainter(self)
self.drawColorBar(painter, self.rect())
def drawColorBar(self, painter, rect):
h1, s1, v1, _ = self.__light.getHsv()
h2, s2, v2, _ = self.__dark.getHsv()
painter.save()
painter.setClipRect(rect)
painter.setClipping(True)
painter.fillRect(rect, QBrush(self.__dark))
sectionSize = 2
if self.__orientation == Qt.Horizontal:
numIntervals = rect.width() / sectionSize
else:
numIntervals = rect.height() / sectionSize
section = QRect()
for i in range(int(numIntervals)):
if self.__orientation == Qt.Horizontal:
section.setRect(
rect.x() + i * sectionSize, rect.y(), sectionSize, rect.heigh()
)
else:
section.setRect(
rect.x(), rect.y() + i * sectionSize, rect.width(), sectionSize
)
ratio = float(i) / float(numIntervals)
color = QColor()
color.setHsv(
h1 + int(ratio * (h2 - h1) + 0.5),
s1 + int(ratio * (s2 - s1) + 0.5),
v1 + int(ratio * (v2 - v1) + 0.5),
)
painter.fillRect(section, color)
painter.restore()
class Plot(QwtPlot):
def __init__(self, *args):
QwtPlot.__init__(self, *args)
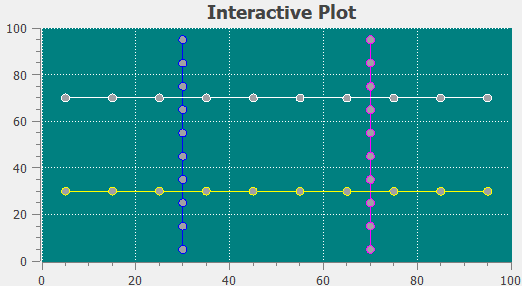
self.setTitle("Interactive Plot")
self.setCanvasColor(Qt.darkCyan)
grid = QwtPlotGrid()
grid.attach(self)
grid.setMajorPen(QPen(Qt.white, 0, Qt.DotLine))
self.setAxisScale(QwtPlot.xBottom, 0.0, 100.0)
self.setAxisScale(QwtPlot.yLeft, 0.0, 100.0)
# Avoid jumping when label with 3 digits
# appear/disappear when scrolling vertically
scaleDraw = self.axisScaleDraw(QwtPlot.yLeft)
scaleDraw.setMinimumExtent(
scaleDraw.extent(self.axisWidget(QwtPlot.yLeft).font())
)
self.plotLayout().setAlignCanvasToScales(True)
self.__insertCurve(Qt.Vertical, Qt.blue, 30.0)
self.__insertCurve(Qt.Vertical, Qt.magenta, 70.0)
self.__insertCurve(Qt.Horizontal, Qt.yellow, 30.0)
self.__insertCurve(Qt.Horizontal, Qt.white, 70.0)
self.replot()
scaleWidget = self.axisWidget(QwtPlot.yLeft)
scaleWidget.setMargin(10)
self.__colorBar = ColorBar(Qt.Vertical, scaleWidget)
self.__colorBar.setRange(QColor(Qt.red), QColor(Qt.darkBlue))
self.__colorBar.setFocusPolicy(Qt.TabFocus)
self.__colorBar.colorSelected.connect(self.setCanvasColor)
# we need the resize events, to lay out the color bar
scaleWidget.installEventFilter(self)
# we need the resize events, to lay out the wheel
self.canvas().installEventFilter(self)
scaleWidget.setWhatsThis(
"Selecting a value at the scale will insert a new curve."
)
self.__colorBar.setWhatsThis(
"Selecting a color will change the background of the plot."
)
self.axisWidget(QwtPlot.xBottom).setWhatsThis(
"Selecting a value at the scale will insert a new curve."
)
def setCanvasColor(self, color):
self.setCanvasBackground(color)
self.replot()
def scrollLeftAxis(self, value):
self.setAxisScale(QwtPlot.yLeft, value, value + 100)
self.replot()
def eventFilter(self, obj, event):
if event.type() == QEvent.Resize:
size = event.size()
if obj == self.axisWidget(QwtPlot.yLeft):
margin = 2
x = size.width() - obj.margin() + margin
w = obj.margin() - 2 * margin
y = int(obj.startBorderDist())
h = int(size.height() - obj.startBorderDist() - obj.endBorderDist())
self.__colorBar.setGeometry(x, y, w, h)
return QwtPlot.eventFilter(self, obj, event)
def insertCurve(self, axis, base):
if axis == QwtPlot.yLeft or axis == QwtPlot.yRight:
o = Qt.Horizontal
else:
o = Qt.Vertical
self.__insertCurve(o, QColor(Qt.red), base)
self.replot()
def __insertCurve(self, orientation, color, base):
curve = QwtPlotCurve()
curve.attach(self)
curve.setPen(QPen(color))
curve.setSymbol(
QwtSymbol(QwtSymbol.Ellipse, QBrush(Qt.gray), QPen(color), QSize(8, 8))
)
fixed = base * np.ones(10, float)
changing = np.arange(0, 95.0, 10.0, float) + 5.0
if orientation == Qt.Horizontal:
curve.setData(changing, fixed)
else:
curve.setData(fixed, changing)
class CanvasPicker(QObject):
def __init__(self, plot):
QObject.__init__(self, plot)
self.__selectedCurve = None
self.__selectedPoint = -1
self.__plot = plot
canvas = plot.canvas()
canvas.installEventFilter(self)
# We want the focus, but no focus rect.
# The selected point will be highlighted instead.
canvas.setFocusPolicy(Qt.StrongFocus)
canvas.setCursor(Qt.PointingHandCursor)
canvas.setFocusIndicator(QwtPlotCanvas.ItemFocusIndicator)
canvas.setFocus()
canvas.setWhatsThis(
"All points can be moved using the left mouse button "
"or with these keys:\n\n"
"- Up: Select next curve\n"
"- Down: Select previous curve\n"
'- Left, "-": Select next point\n'
'- Right, "+": Select previous point\n'
"- 7, 8, 9, 4, 6, 1, 2, 3: Move selected point"
)
self.__shiftCurveCursor(True)
def event(self, event):
if event.type() == QEvent.User:
self.__showCursor(True)
return True
return QObject.event(self, event)
def eventFilter(self, object, event):
if event.type() == QEvent.FocusIn:
self.__showCursor(True)
if event.type() == QEvent.FocusOut:
try:
self.__showCursor(False)
except RuntimeError:
pass # ignore error when closing the application
if event.type() == QEvent.Paint:
QApplication.postEvent(self, QEvent(QEvent.User))
elif event.type() == QEvent.MouseButtonPress:
self.__select(event.position())
return True
elif event.type() == QEvent.MouseMove:
self.__move(event.position())
return True
if event.type() == QEvent.KeyPress:
delta = 5
key = event.key()
if key == Qt.Key_Up:
self.__shiftCurveCursor(True)
return True
elif key == Qt.Key_Down:
self.__shiftCurveCursor(False)
return True
elif key == Qt.Key_Right or key == Qt.Key_Plus:
if self.__selectedCurve:
self.__shiftPointCursor(True)
else:
self.__shiftCurveCursor(True)
return True
elif key == Qt.Key_Left or key == Qt.Key_Minus:
if self.__selectedCurve:
self.__shiftPointCursor(False)
else:
self.__shiftCurveCursor(True)
return True
if key == Qt.Key_1:
self.__moveBy(-delta, delta)
elif key == Qt.Key_2:
self.__moveBy(0, delta)
elif key == Qt.Key_3:
self.__moveBy(delta, delta)
elif key == Qt.Key_4:
self.__moveBy(-delta, 0)
elif key == Qt.Key_6:
self.__moveBy(delta, 0)
elif key == Qt.Key_7:
self.__moveBy(-delta, -delta)
elif key == Qt.Key_8:
self.__moveBy(0, -delta)
elif key == Qt.Key_9:
self.__moveBy(delta, -delta)
return False
def __select(self, pos):
found, distance, point = None, 1e100, -1
for curve in self.__plot.itemList():
if isinstance(curve, QwtPlotCurve):
i, d = curve.closestPoint(pos)
if d < distance:
found = curve
point = i
distance = d
self.__showCursor(False)
self.__selectedCurve = None
self.__selectedPoint = -1
if found and distance < 10:
self.__selectedCurve = found
self.__selectedPoint = point
self.__showCursor(True)
def __moveBy(self, dx, dy):
if dx == 0 and dy == 0:
return
curve = self.__selectedCurve
if not curve:
return
s = curve.sample(self.__selectedPoint)
x = self.__plot.transform(curve.xAxis(), s.x()) + dx
y = self.__plot.transform(curve.yAxis(), s.y()) + dy
self.__move(QPoint(x, y))
def __move(self, pos):
curve = self.__selectedCurve
if not curve:
return
xData = np.zeros(curve.dataSize(), float)
yData = np.zeros(curve.dataSize(), float)
for i in range(curve.dataSize()):
if i == self.__selectedPoint:
xData[i] = self.__plot.invTransform(curve.xAxis(), pos.x())
yData[i] = self.__plot.invTransform(curve.yAxis(), pos.y())
else:
s = curve.sample(i)
xData[i] = s.x()
yData[i] = s.y()
curve.setData(xData, yData)
self.__showCursor(True)
self.__plot.replot()
def __showCursor(self, showIt):
curve = self.__selectedCurve
if not curve:
return
symbol = curve.symbol()
brush = symbol.brush()
if showIt:
symbol.setBrush(symbol.brush().color().darker(180))
curve.directPaint(self.__selectedPoint, self.__selectedPoint)
if showIt:
symbol.setBrush(brush)
def __shiftCurveCursor(self, up):
curves = [
curve for curve in self.__plot.itemList() if isinstance(curve, QwtPlotCurve)
]
if not curves:
return
if self.__selectedCurve in curves:
index = curves.index(self.__selectedCurve)
if up:
index += 1
else:
index -= 1
# keep index within [0, len(curves))
index += len(curves)
index %= len(curves)
else:
index = 0
self.__showCursor(False)
self.__selectedPoint = 0
self.__selectedCurve = curves[index]
self.__showCursor(True)
def __shiftPointCursor(self, up):
curve = self.__selectedCurve
if not curve:
return
if up:
index = self.__selectedPoint + 1
else:
index = self.__selectedPoint - 1
# keep index within [0, curve.dataSize())
index += curve.dataSize()
index %= curve.dataSize()
if index != self.__selectedPoint:
self.__showCursor(False)
self.__selectedPoint = index
self.__showCursor(True)
class ScalePicker(QObject):
clicked = Signal(int, float)
def __init__(self, plot):
QObject.__init__(self, plot)
for axis_id in QwtPlot.AXES:
scaleWidget = plot.axisWidget(axis_id)
if scaleWidget:
scaleWidget.installEventFilter(self)
def eventFilter(self, object, event):
if event.type() == QEvent.MouseButtonPress:
self.__mouseClicked(object, event.position())
return True
return QObject.eventFilter(self, object, event)
def __mouseClicked(self, scale, pos):
rect = self.__scaleRect(scale)
margin = 10
rect.setRect(
rect.x() - margin,
rect.y() - margin,
rect.width() + 2 * margin,
rect.height() + 2 * margin,
)
if rect.contains(pos):
value = 0.0
axis = -1
sd = scale.scaleDraw()
if scale.alignment() == QwtScaleDraw.LeftScale:
value = sd.scaleMap().invTransform(pos.y())
axis = QwtPlot.yLeft
elif scale.alignment() == QwtScaleDraw.RightScale:
value = sd.scaleMap().invTransform(pos.y())
axis = QwtPlot.yRight
elif scale.alignment() == QwtScaleDraw.BottomScale:
value = sd.scaleMap().invTransform(pos.x())
axis = QwtPlot.xBottom
elif scale.alignment() == QwtScaleDraw.TopScale:
value = sd.scaleMap().invTransform(pos.x())
axis = QwtPlot.xBottom
self.clicked.emit(axis, value)
def __scaleRect(self, scale):
bld = scale.margin()
mjt = scale.scaleDraw().tickLength(QwtScaleDiv.MajorTick)
sbd = scale.startBorderDist()
ebd = scale.endBorderDist()
if scale.alignment() == QwtScaleDraw.LeftScale:
return QRect(
scale.width() - bld - mjt, sbd, mjt, scale.height() - sbd - ebd
)
elif scale.alignment() == QwtScaleDraw.RightScale:
return QRect(bld, sbd, mjt, scale.height() - sbd - ebd)
elif scale.alignment() == QwtScaleDraw.BottomScale:
return QRect(sbd, bld, scale.width() - sbd - ebd, mjt)
elif scale.alignment() == QwtScaleDraw.TopScale:
return QRect(
sbd, scale.height() - bld - mjt, scale.width() - sbd - ebd, mjt
)
else:
return QRect()
class EventFilterWindow(QMainWindow):
def __init__(self, parent=None):
super(EventFilterWindow, self).__init__(parent=parent)
toolBar = QToolBar(self)
toolBar.addAction(QWhatsThis.createAction(toolBar))
self.addToolBar(toolBar)
plot = Plot()
self.setCentralWidget(plot)
plot.setWhatsThis(
"An useless plot to demonstrate how to use event filtering.\n\n"
"You can click on the color bar, the scales or move the slider.\n"
"All points can be moved using the mouse or the keyboard."
)
CanvasPicker(plot)
scalePicker = ScalePicker(plot)
scalePicker.clicked.connect(plot.insertCurve)
def test_eventfilter():
"""Event filter example"""
utils.test_widget(EventFilterWindow, size=(540, 400))
if __name__ == "__main__":
test_eventfilter()