import numpy as np
from qtpy.QtCore import Qt
from qtpy.QtGui import QPen, qRgb
from qwt import (
QwtInterval,
QwtLegend,
QwtLegendData,
QwtLinearColorMap,
QwtPlot,
QwtPlotCurve,
QwtPlotGrid,
QwtPlotItem,
QwtPlotMarker,
QwtScaleMap,
toQImage,
)
from qwt.tests import utils
def bytescale(data, cmin=None, cmax=None, high=255, low=0):
if (hasattr(data, "dtype") and data.dtype.char == np.uint8) or (
hasattr(data, "typecode") and data.typecode == np.uint8
):
return data
high = high - low
if cmin is None:
cmin = min(np.ravel(data))
if cmax is None:
cmax = max(np.ravel(data))
scale = high * 1.0 / (cmax - cmin or 1)
bytedata = ((data * 1.0 - cmin) * scale + 0.4999).astype(np.uint8)
return bytedata + np.asarray(low).astype(np.uint8)
def linearX(nx, ny):
return np.repeat(np.arange(nx, typecode=np.float32)[:, np.newaxis], ny, -1)
def linearY(nx, ny):
return np.repeat(np.arange(ny, typecode=np.float32)[np.newaxis, :], nx, 0)
def square(n, min, max):
t = np.arange(min, max, float(max - min) / (n - 1))
# return outer(cos(t), sin(t))
return np.cos(t) * np.sin(t)[:, np.newaxis]
class PlotImage(QwtPlotItem):
def __init__(self, title=""):
QwtPlotItem.__init__(self)
self.setTitle(title)
self.setItemAttribute(QwtPlotItem.Legend)
self.xyzs = None
def setData(self, xyzs, xRange=None, yRange=None):
self.xyzs = xyzs
shape = xyzs.shape
if not xRange:
xRange = (0, shape[0])
if not yRange:
yRange = (0, shape[1])
self.xMap = QwtScaleMap(0, xyzs.shape[0], *xRange)
self.plot().setAxisScale(QwtPlot.xBottom, *xRange)
self.yMap = QwtScaleMap(0, xyzs.shape[1], *yRange)
self.plot().setAxisScale(QwtPlot.yLeft, *yRange)
self.image = toQImage(bytescale(self.xyzs)).mirrored(False, True)
for i in range(0, 256):
self.image.setColor(i, qRgb(i, 0, 255 - i))
def updateLegend(self, legend, data):
QwtPlotItem.updateLegend(self, legend, data)
legend.find(self).setText(self.title())
def draw(self, painter, xMap, yMap, rect):
"""Paint image zoomed to xMap, yMap
Calculate (x1, y1, x2, y2) so that it contains at least 1 pixel,
and copy the visible region to scale it to the canvas.
"""
assert isinstance(self.plot(), QwtPlot)
# calculate y1, y2
# the scanline order (index y) is inverted with respect to the y-axis
y1 = y2 = self.image.height()
y1 *= self.yMap.s2() - yMap.s2()
y1 /= self.yMap.s2() - self.yMap.s1()
y1 = max(0, int(y1 - 0.5))
y2 *= self.yMap.s2() - yMap.s1()
y2 /= self.yMap.s2() - self.yMap.s1()
y2 = min(self.image.height(), int(y2 + 0.5))
# calculate x1, x2 -- the pixel order (index x) is normal
x1 = x2 = self.image.width()
x1 *= xMap.s1() - self.xMap.s1()
x1 /= self.xMap.s2() - self.xMap.s1()
x1 = max(0, int(x1 - 0.5))
x2 *= xMap.s2() - self.xMap.s1()
x2 /= self.xMap.s2() - self.xMap.s1()
x2 = min(self.image.width(), int(x2 + 0.5))
# copy
image = self.image.copy(x1, y1, x2 - x1, y2 - y1)
# zoom
image = image.scaled(
int(xMap.p2() - xMap.p1() + 1), int(yMap.p1() - yMap.p2() + 1)
)
# draw
painter.drawImage(int(xMap.p1()), int(yMap.p2()), image)
class ImagePlot(QwtPlot):
def __init__(self, *args):
QwtPlot.__init__(self, *args)
# set plot title
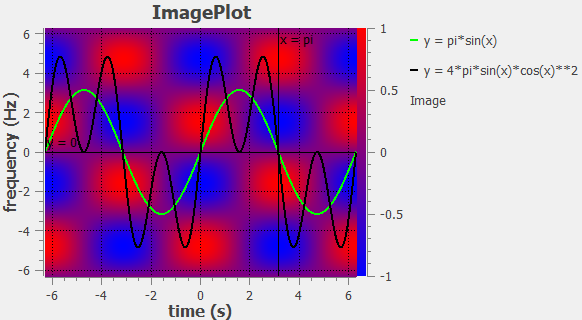
self.setTitle("ImagePlot")
# set plot layout
self.plotLayout().setCanvasMargin(0)
self.plotLayout().setAlignCanvasToScales(True)
# set legend
legend = QwtLegend()
legend.setDefaultItemMode(QwtLegendData.Clickable)
self.insertLegend(legend, QwtPlot.RightLegend)
# set axis titles
self.setAxisTitle(QwtPlot.xBottom, "time (s)")
self.setAxisTitle(QwtPlot.yLeft, "frequency (Hz)")
colorMap = QwtLinearColorMap(Qt.blue, Qt.red)
interval = QwtInterval(-1, 1)
self.enableAxis(QwtPlot.yRight)
self.setAxisScale(QwtPlot.yRight, -1, 1)
self.axisWidget(QwtPlot.yRight).setColorBarEnabled(True)
self.axisWidget(QwtPlot.yRight).setColorMap(interval, colorMap)
# calculate 3 NumPy arrays
x = np.arange(-2 * np.pi, 2 * np.pi, 0.01)
y = np.pi * np.sin(x)
z = 4 * np.pi * np.cos(x) * np.cos(x) * np.sin(x)
# attach a curve
QwtPlotCurve.make(
x, y, title="y = pi*sin(x)", linecolor=Qt.green, linewidth=2, plot=self
)
# attach another curve
QwtPlotCurve.make(
x, z, title="y = 4*pi*sin(x)*cos(x)**2", linewidth=2, plot=self
)
# attach a grid
grid = QwtPlotGrid()
grid.attach(self)
grid.setPen(QPen(Qt.black, 0, Qt.DotLine))
# attach a horizontal marker at y = 0
QwtPlotMarker.make(
label="y = 0",
linestyle=QwtPlotMarker.HLine,
align=Qt.AlignRight | Qt.AlignTop,
plot=self,
)
# attach a vertical marker at x = pi
QwtPlotMarker.make(
np.pi,
0.0,
label="x = pi",
linestyle=QwtPlotMarker.VLine,
align=Qt.AlignRight | Qt.AlignBottom,
plot=self,
)
# attach a plot image
plotImage = PlotImage("Image")
plotImage.attach(self)
plotImage.setData(
square(512, -2 * np.pi, 2 * np.pi),
(-2 * np.pi, 2 * np.pi),
(-2 * np.pi, 2 * np.pi),
)
legend.clicked.connect(self.toggleVisibility)
# replot
self.replot()
def toggleVisibility(self, plotItem, idx):
"""Toggle the visibility of a plot item"""
plotItem.setVisible(not plotItem.isVisible())
self.replot()
def test_image():
"""Image plot test"""
utils.test_widget(ImagePlot, size=(600, 400))
if __name__ == "__main__":
test_image()