import numpy as np
np.seterr(all="raise")
from qtpy.QtCore import Qt
from qwt import QwtLogScaleEngine, QwtPlot, QwtPlotCurve
from qwt.tests import utils
class LogCurvePlot(QwtPlot):
def __init__(self):
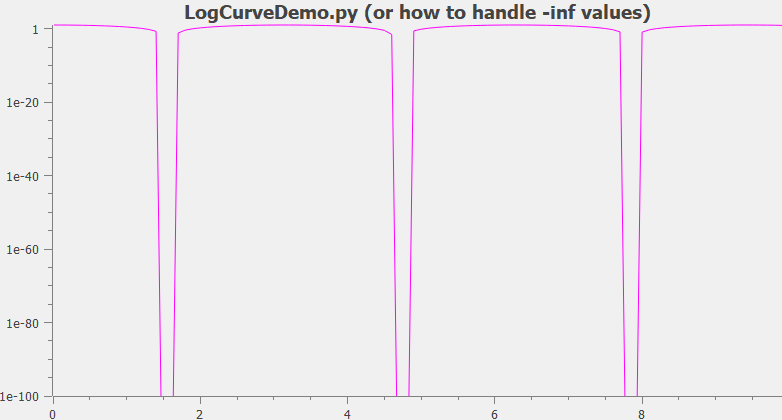
super(LogCurvePlot, self).__init__(
"LogCurveDemo.py (or how to handle -inf values)"
)
self.enableAxis(QwtPlot.xBottom)
self.setAxisScaleEngine(QwtPlot.yLeft, QwtLogScaleEngine())
x = np.arange(0.0, 10.0, 0.1)
y = 10 * np.cos(x) ** 2 - 0.1
QwtPlotCurve.make(x, y, linecolor=Qt.magenta, plot=self, antialiased=True)
self.replot()
def test_logcurve():
"""Log curve demo"""
utils.test_widget(LogCurvePlot, size=(800, 500))
if __name__ == "__main__":
test_logcurve()